example Constant ductility response spectra
Generate the constant ductility response spectra and associated results of an earthquake suite using OpenSeismoMatlab.
Contents
Input
earthquake motions
eqmotions={'Imperial Valley'; % Imperial valley 1979
    'Kocaeli';
    'Loma Prieta';
    'Northridge';
    'San Fernando';
    'Spitak';
    'Cape Mendocino';
    'ChiChi';
    'elcentro_NS_trunc'; % Imperial valley 1940
    'Hollister';
    'Kobe'};
Set the eigenperiod range for which the response spectra will be calculated.
Tspectra=(0.08:0.08:4)';
Set critical damping ratio of the response spectra to be calculated.
ksi=0.05;
Set the target ductility (not used here)
mu=2;
Set the postyield stiffness factor for each earthquake
p=[0.02;0.01;0.02;0.01;0.01;0.01;0.02;0.01;0.01;0.01;0.01];
Extract nonlinear response spectra
sw='cdrs';
Calculation
Initialize CDRS
CDRS=cell(numel(eqmotions),1);
% Calculation of peak values
for i=1:numel(eqmotions)
    % earthquake
    data=load([eqmotions{i},'.dat']);
    t=data(:,1);
    dt=t(2)-t(1);
    xgtt=data(:,2);
    S=OpenSeismoMatlab(dt,xgtt,sw,Tspectra,ksi,mu,p(i));
    CDRS{i}=[S.Period,S.CDSd,S.CDSv,S.CDPSa,S.fyK,S.muK,S.iterK];
end
Output
Plot constant ductility spectral displacement
Fig1 = figure('units', 'centimeters', 'Position', [0,0, 20/sqrt(2), 20]);
% Scan all subplots
for i=1:numel(eqmotions)
    subplot(4,3,i)
    plot(CDRS{i}(:,1),CDRS{i}(:,2),'k','LineWidth',1);
    set(gca,'FontName','Times New Roman')
    title(eqmotions{i},'FontName','Times New Roman')
    ylabel('Sd','FontName','Times New Roman')
    xlabel('Period (s)','FontName','Times New Roman')
    axis tight
end
drawnow;
pause(0.1)

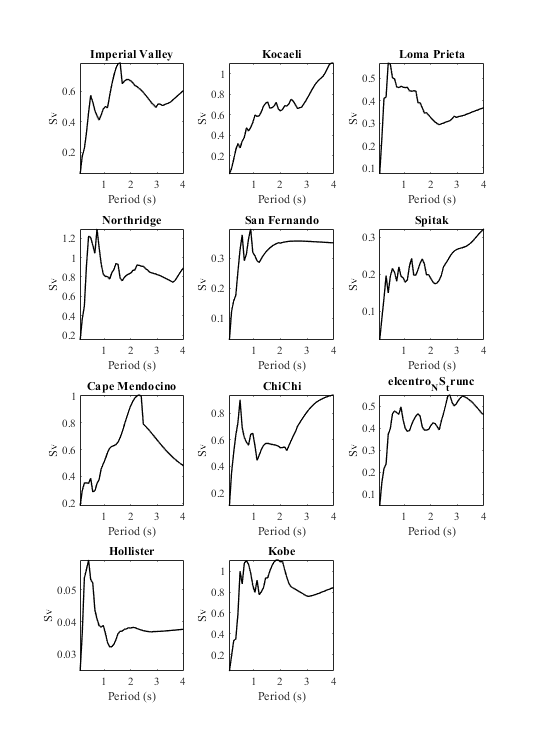
Plot constant ductility spectral velocity
Fig2 = figure('units', 'centimeters', 'Position', [0,0, 20/sqrt(2), 20]);
% Scan all subplots
for i=1:numel(eqmotions)
    subplot(4,3,i)
    plot(CDRS{i}(:,1),CDRS{i}(:,3),'k','LineWidth',1);
    set(gca,'FontName','Times New Roman')
    title(eqmotions{i},'FontName','Times New Roman')
    ylabel('Sv','FontName','Times New Roman')
    xlabel('Period (s)','FontName','Times New Roman')
    axis tight
end
drawnow;
pause(0.1)
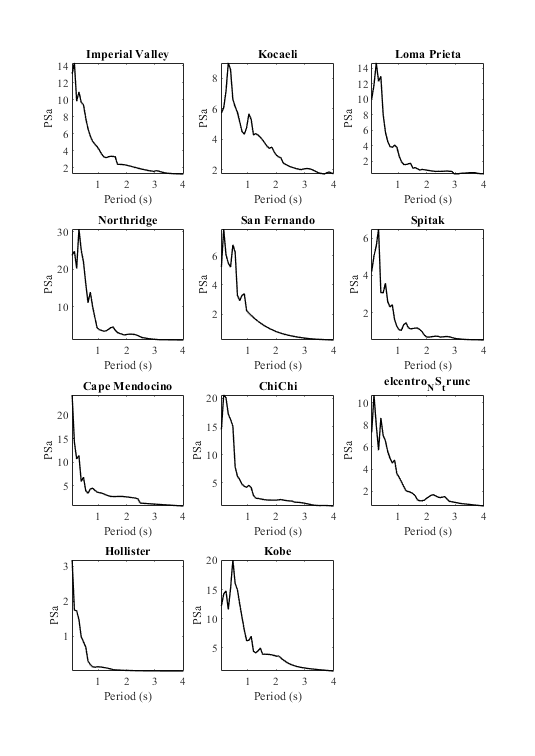
Plot constant ductility spectral acceleration
Fig3 = figure('units', 'centimeters', 'Position', [0,0, 20/sqrt(2), 20]);
% Scan all subplots
for i=1:numel(eqmotions)
    subplot(4,3,i)
    plot(CDRS{i}(:,1),CDRS{i}(:,4),'k','LineWidth',1);
    set(gca,'FontName','Times New Roman')
    title(eqmotions{i},'FontName','Times New Roman')
    ylabel('PSa','FontName','Times New Roman')
    xlabel('Period (s)','FontName','Times New Roman')
    axis tight
end
drawnow;
pause(0.1)
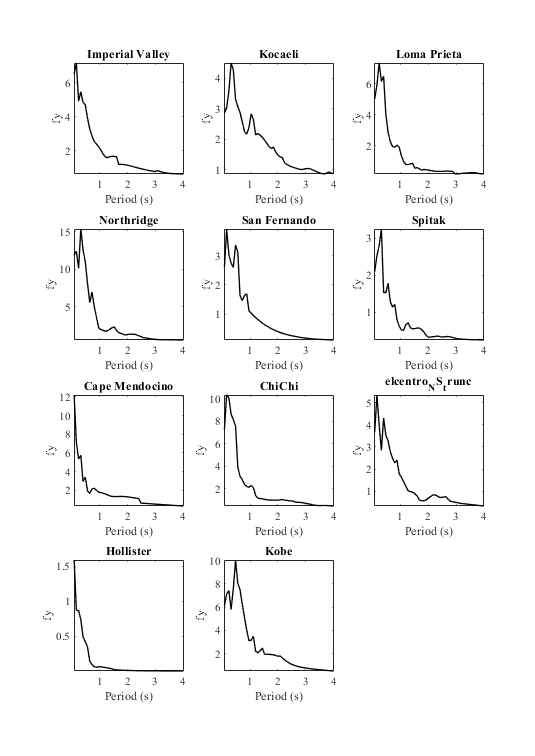
Plot constant ductility spectral yield limit
Fig4 = figure('units', 'centimeters', 'Position', [0,0, 20/sqrt(2), 20]);
% Scan all subplots
for i=1:numel(eqmotions)
    subplot(4,3,i)
    plot(CDRS{i}(:,1),CDRS{i}(:,5),'k','LineWidth',1);
    set(gca,'FontName','Times New Roman')
    title(eqmotions{i},'FontName','Times New Roman')
    ylabel('fy','FontName','Times New Roman')
    xlabel('Period (s)','FontName','Times New Roman')
    axis tight
end
drawnow;
pause(0.1)
Plot constant ductility spectral achieved ductility
Fig5 = figure('units', 'centimeters', 'Position', [0,0, 20/sqrt(2), 20]);
% Scan all subplots
for i=1:numel(eqmotions)
    subplot(4,3,i)
    plot(CDRS{i}(:,1),CDRS{i}(:,6),'k','LineWidth',1);
    set(gca,'FontName','Times New Roman')
    title(eqmotions{i},'FontName','Times New Roman')
    ylabel('mu','FontName','Times New Roman')
    xlabel('Period (s)','FontName','Times New Roman')
    axis tight
end
drawnow;
pause(0.1)

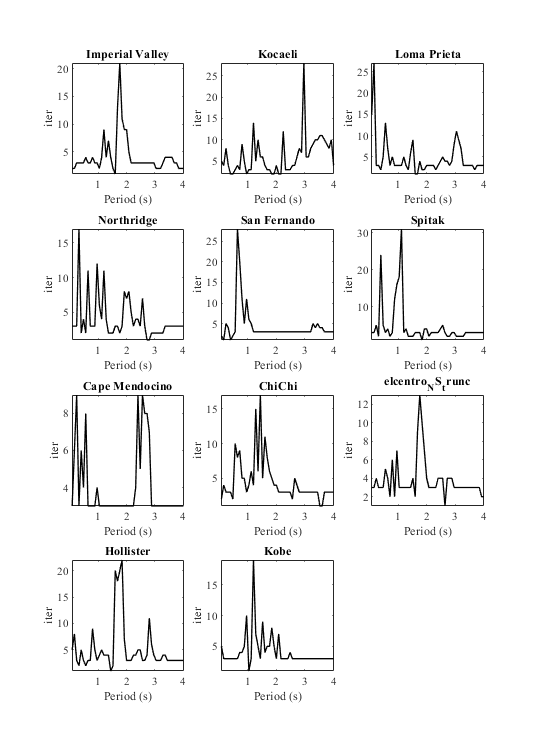
Plot constant ductility spectral number of iterations needed for convergence
Fig6 = figure('units', 'centimeters', 'Position', [0,0, 20/sqrt(2), 20]);
% Scan all subplots
for i=1:numel(eqmotions)
    subplot(4,3,i)
    plot(CDRS{i}(:,1),CDRS{i}(:,7),'k','LineWidth',1);
    set(gca,'FontName','Times New Roman')
    title(eqmotions{i},'FontName','Times New Roman')
    ylabel('iter','FontName','Times New Roman')
    xlabel('Period (s)','FontName','Times New Roman')
    axis tight
end
drawnow;
pause(0.1)
Copyright
Copyright (c) 2018-2023 by George Papazafeiropoulos
- Major, Infrastructure Engineer, Hellenic Air Force
- Civil Engineer, M.Sc., Ph.D.
- Email: gpapazafeiropoulos@yahoo.gr